Gold prices moved noticeably on February 27, 2026, with markets in India and internationally reporting mixed signals. Traders and buyers watched prices shift after recent volatility, while analysts weighed short-term trends and key support levels.
On the Multi Commodity Exchange (MCX), gold hovered near ₹1.60 lakh per 10 grams, reflecting ongoing trading interest but also short-term consolidation. International spot gold similarly showed sideways movement as traders reacted to global cues.
This matters because gold remains a core asset for both retail buyers and institutional investors. Sharp price moves can affect jewelry purchasing decisions, portfolio allocations, and safe-haven demand. Short-term price action may also shape outlooks for the weeks ahead.

Gold Price: Key Facts Today
| Event | Location | Date | Who Is Affected | Current Status | What Readers Should Know |
|---|---|---|---|---|---|
| Gold price update | India & global markets | February 27, 2026 | Precious metals buyers, investors | Prices holding near ₹1.60 lakh/10g (MCX) with volatility | Markets saw mixed movement; fundamentals still in play |
| Price driver | International markets | Feb. 27, 2026 | Traders, exporters, importers | Spot gold consolidating near $5,180–$5,200/oz | Safe-haven cues, dollar influence remain key |
| Buyer indicator | MCX futures | Feb. 27, 2026 | Commodity traders | Mixed futures activity | Technical signals suggest caution |
| Local rates | Major Indian cities | Feb. 27, 2026 | Consumers & jewelers | Slight gains or pullbacks reported | Regional pricing varies across metros |
| Market sentiment | Reddit traders & analysts | Feb. 27, 2026 | Individual traders | Mixed bullish & bearish views | Dips seen as buy opportunities by some |
What Happened: Prices Around the World and in India
In India, gold prices on the MCX were trading near ₹1.60 lakh per 10 grams on February 27, with some sessions showing small upticks from the previous day’s levels. Silver was also active, climbing over 2% in afternoon trade.
Across major cities, 24-carat and 22-carat gold rates showed slight variation. In some reports, 24K gold hovered above ₹1.60 lakh per 10 grams, and in others prices dipped marginally due to local supply/demand nuance and dollar influence.
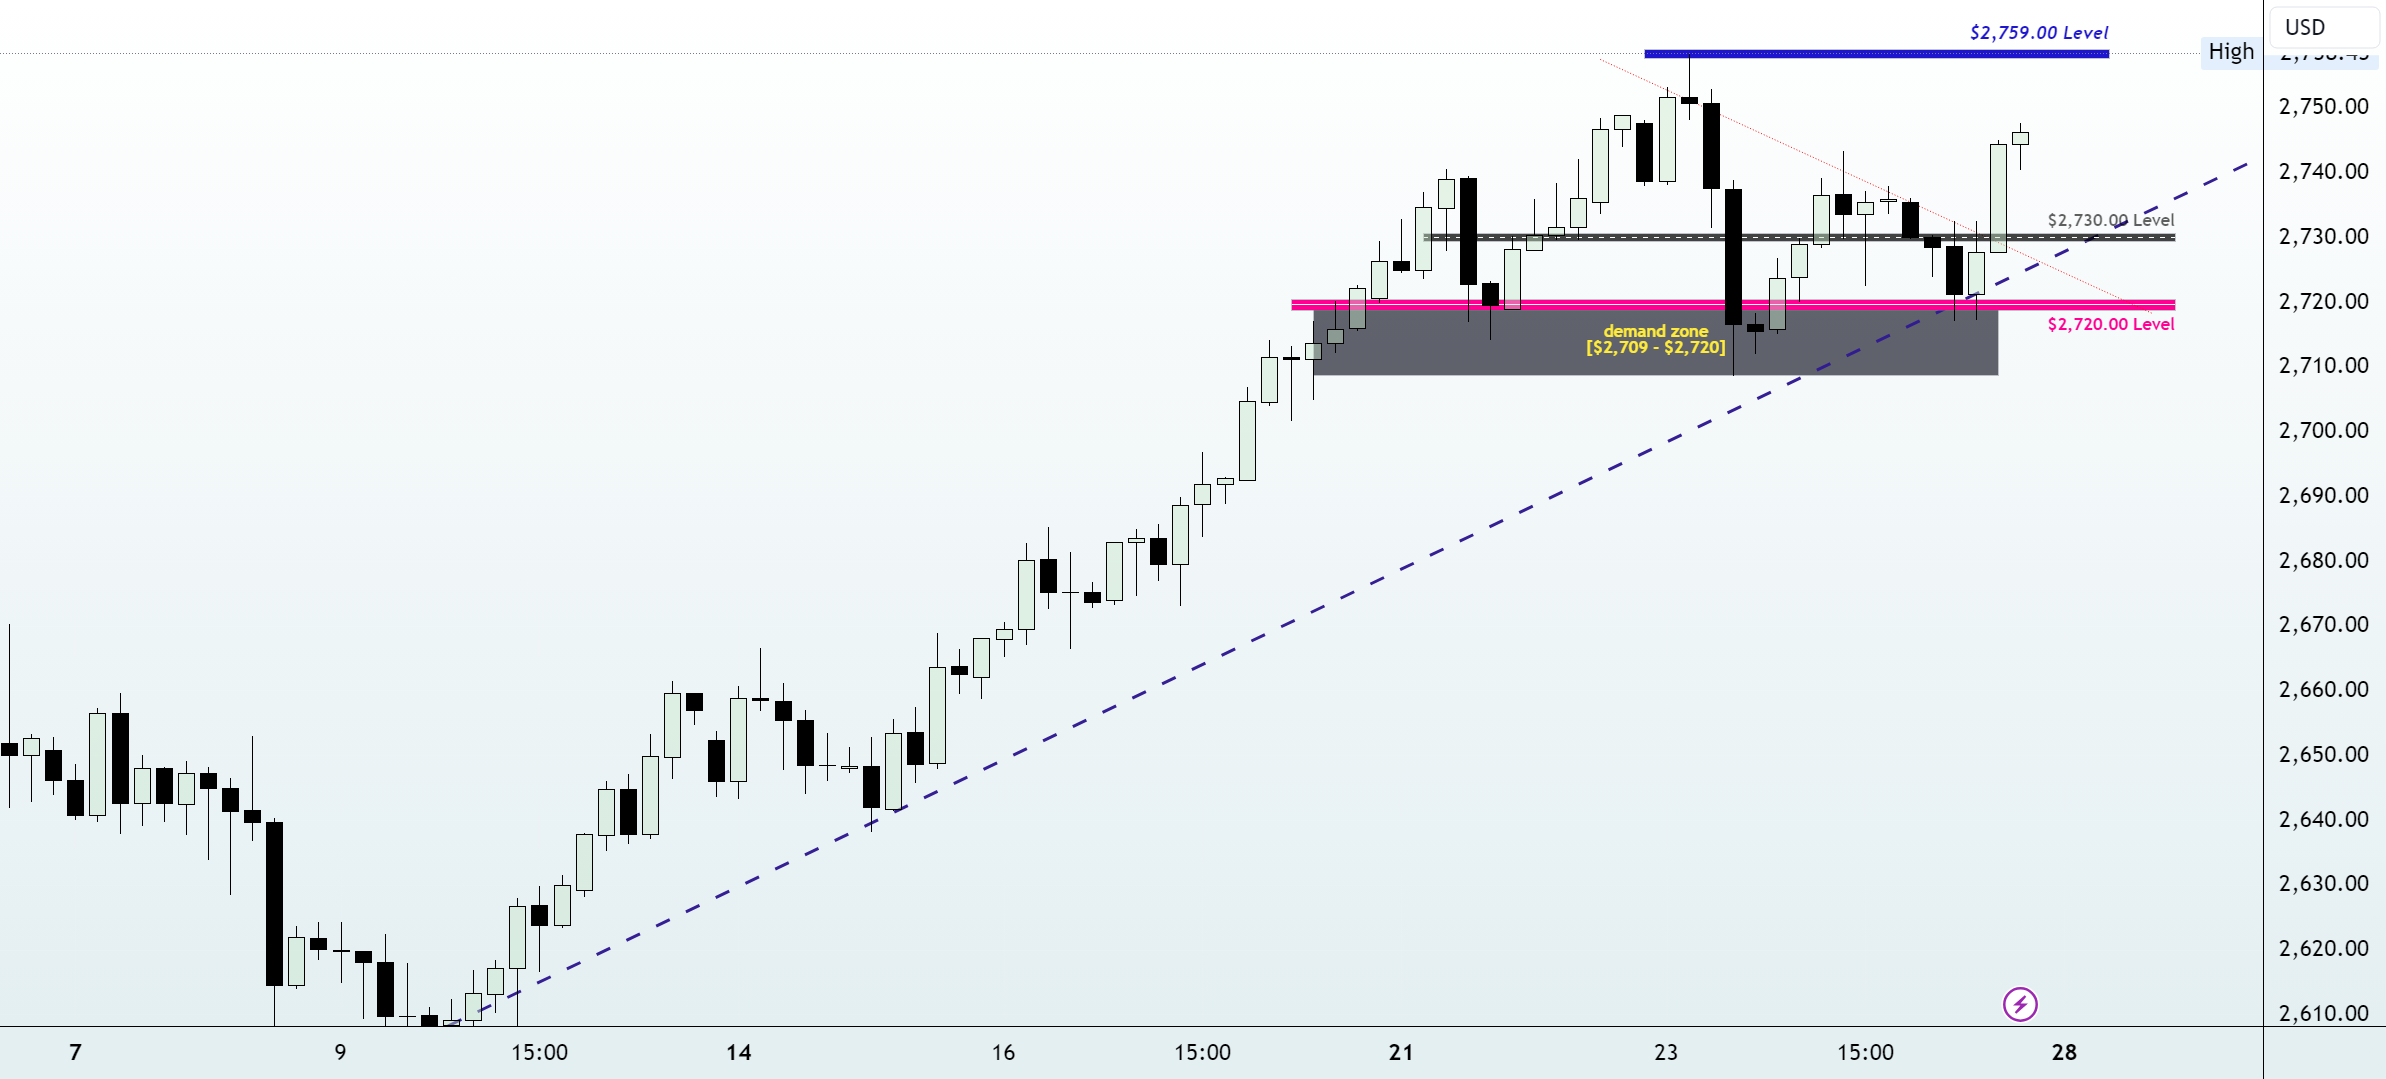
Internationally, spot gold consolidated near the $5,180 to $5,200 per ounce range. Traders referenced technical support and resistance levels in online communities, noting that sustained holds above key levels could signal further momentum.

Background: What Has Driven Gold’s Movement
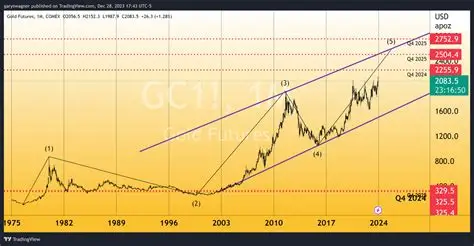
Gold prices have seen volatility in early 2026. In February, prices rebounded from lower levels earlier in the month after a volatile phase. The yellow metal has been reacting to macroeconomic cues such as currency strength and geopolitical sentiment.
Safe-haven demand, central bank buying trends, and ETF flows have been cited by analysts as structural drivers, while short-term price swings reflect trader positioning around economic data and risk appetite.
Over recent months, prices remained elevated compared to year-ago levels, a sign that gold continues to attract interest as a store of value amid market shifts.

Timeline: Key Price Moves
- Early February 2026: Gold experienced significant volatility, with prices fluctuating sharply.
- Mid-February: Market showed a rebound from earlier lows.
- Feb. 23–25: Prices climbed back above key support levels in Indian markets.
- Feb. 26–27: Prices consolidated as traders reacted to macro cues and global sentiment.
Official Signals and Analyst Commentary
There are no central bank price mandates for gold, but voices from financial markets and councils underline trends. Traders on social platforms highlighted technical setups where dips might present buying opportunities, especially if key supports hold above recent lows.
In terms of fundamentals, institutional reports emphasize that investment demand through ETFs and reserve accumulation continue to support long-term gold interest, even if short-term price swings persist.
Public Reaction and Market Interpretation
Online trader communities showed mixed sentiment. Some posted bullish setups, noting sustained support levels and structural uptrends on charts. Others highlighted that resistance zones could limit next leg gains unless stronger catalysts arise.

In local markets, consumer discussions often focus on whether current prices justify buying for weddings or gifting occasions. That perspective frequently influences retail demand patterns separate from professional trading signals.
Should You Buy On Dips? What Analysts Suggest
Market commentators often point to price pullbacks as entry points when underlying trends show structural strength. For gold, this means watching technical support zones and macro drivers like currency strength, inflation expectations, and geopolitical developments.
Traders on financial forums frequently use terms like “buy on dips” when prices touch defined support levels, signaling risk-reward setups in short-term trading. Still, no single view commands consensus, and investors often look beyond daily noise.

What Happens Next: Near-Term Outlook
Gold markets are likely to remain sensitive to macroeconomic data and global risk cues. Dollar weakness or strength, inflation measures, and geopolitical developments will continue to guide pricing.
Investors will watch key support and resistance levels closely. In the short term, consolidation around current levels suggests caution, while breakouts above recent highs may trigger further momentum.
Frequently Asked Questions (FAQs)
Q1: What is the current gold price trend on Feb. 27, 2026?
Gold prices on major exchanges showed mixed moves with consolidation near ₹1.60 lakh/10g in India and near $5,180–$5,200 internationally.
Q2: Should buyers consider purchasing gold now?
Some traders view minor price dips as potential buying zones, but individual strategy depends on investment goals and risk tolerance.
Q3: What influences gold prices today?
Gold prices react to currency movements, global economic data, geopolitical sentiment, and investor demand for safe-haven assets.
Q4: How do technical traders view current gold levels?
Many watch key support and resistance zones as benchmarks for possible upside or corrective moves.

Q5: Is gold still considered a safe-haven investment?
Yes. Many investors still view gold as a hedge during economic uncertainty, although price swings can be volatile.
Q6: What’s the difference between MCX and international gold prices?
MCX reflects local Indian market pricing, while spot gold tracks international rates in U.S. dollars, often impacting local conversions.
Q7: Will gold remain volatile in the coming weeks?
Volatility is likely to persist as markets digest macro data and chart signals continue influencing trading activity.

Closing
Gold markets on February 27, 2026, revealed a mix of stability and short-term price shifts. While consolidation dominates near key levels, market participants are navigating both macroeconomic conditions and technical setups.
For now, watch core support and resistance areas alongside global economic indicators. Next updates on inflation data and currency movements will likely influence the direction of gold prices.


Leave a Comment